Introduction
Task Performed
In this project we created a convolutional neural network and used it to classify the CIFAR-10 dataset. We created a convolutional neural network using eighteen layers, consisting of six layer types. The layer types were image normalization, convolution, rectified linear units, maxpool, fullconnect, and softmax. In the following report, we describe each of these different layers types in detail. We also describe and show observations and results for the CNN, classifying the CIFAR-10 images using provided filters and bias values. Finally, we test our CNN on external images, found online, and present our findings. We hope to achieve a better understanding of convolutional neural networks and their implementation after completing this report. For this specific project, we wish to see that our network will have a good prediction rate accuracy.
Layer Types & Description
Image Normalization
The first step in our convolutional neural network is to normalize the input image we are given. Images are normally given as a set of RGB values. These values range from to for each RGB channel. We then want to normalize all of these values to a range from to . To do this we simply can take the input image and apply the following transformation on it:
For example, let’s say we were given an image pixel with the following values, . Let us apply this image normalization technique to see what we get. So we will have , which gives us as our normalized values. As we can see all the values are are between and . Also, notice that the value was which is nearly half of and as a result we get a value very close to zero after normalization. We can now used this normalized value in the rest of our convolutional neural network. Normalization of data is a necessary and useful technique in most machine learning applications. In MATLAB, this step can be easily implemented and follows exactly from the transformation we have just described. We will just take in the input array and divide by and subtract by .
% Input:       A color image array of size N * M * 3
% Output:      An array of the same size
% Description: Approximately scales each color channel’s
%              pixel values into the output range -0.5 to 0.5.

function out = normalize(in)
    out = in./255.0 - 0.5;
end
Rectified Linear Unit
We use rectified linear unit (ReLU) to threshold the input. These are usually the next layer after convolutions in convolutional neural networks. We define ReLU the following way:
So for any input we are given, we will make sure the output always has values or greater. We will demonstrate this technique by showing you an example on a matrix. We have our original matrix, , defined as follows:
After we apply , we have the result below. The highlighted cells show where the actual thresholding has occurred. All of the negative values in our original matrix have now been set to and everything else has been left alone.
In MATLAB, this can be implemented in one line using the max function of the input array and . You can see from this that MATLAB allows us to easily implement many of these functions in the way they are mathematically defined.
% Input:       An array of size N * M * D
% Output:      An array of the same size
% Description: A thresholding operation where any negative
%              numbers in the input become 0 in the output.

function out = relu(in)
	out = max(in, 0);
end
There are many other types of activation functions such as sigmoid, tanh, and maxout. ReLU has been adopted recently, since they are easy to compute and they lead to faster convergence. In other activation functions, we are forced to compute exponential values which are much computationally heavier than performing a max function. One problem with ReLU has been the fact that neurons can stop activating with ReLU. Once a neuron is not activating it is basically a useless neuron in the network. Leaky ReLU has been used to combat this and are defined as follows:
Maxpool
The maxpool operation is used to down-sample the images. This takes in an input of size and turns it into of size . So it will take in an input of and reduce the number of rows and columns by but we will not change the depth of the input. The maxpool operation is beneficial because it allows us to not overfit to our data and it also allows us to compute a lot less. This is very beneficial to use because training deep networks takes a lot of time and if we have less parameters it will be faster to convergence. We define the maxpool operation as follows:
In MATLAB, the implementation of this is easy. We can assume our image can be divided into multiple smaller grids. Then we simply compute the top left corner, top right corner, bottom left corner, and bottom right corner of each these grids. Then we can find the max of these values and we will have our down-sampled image. We will perform the maxpool operation on the following matrix . The matrix is divided up into different color by grids.
The maxpool operation on matrix A results in in the following matrix. We had to take the maximum value of each of these grids and then put them in their respective location. Now we have our down-sampled matrix, which is half the size.
There are other pooling operations such as average pooling. This can also be computed in a similar way but instead of taking the maximum value of each grid, we take the average. This should still result in a matrix of half the size but will contain different values.
% Input:       An array of size 2N * 2M * D
% Output:      An array of the size N * M * D
% Description: Operates on each channel separately, and assigns
%              output channel values by taking the maximum value
%              in each nonoverlapping 2 * 2 block of the input channel.

function out = maxpool(in)
	a = max(in(1:2:end,1:2:end,:),in(2:2:end,1:2:end,:));
	b = max(in(1:2:end,2:2:end,:),in(2:2:end,2:2:end,:));
	out = max(a,b);
end
Convolution
The convolution layer convolves a set of filters, specified in CNNparameter.mat, over its input. A high filter response indicates similarity between the filter and the input image. Filter responses obtained in the convolution layers of a CNN enable it to make a decision about the class of the input image. It does linear transformation from input to output without changing the spatial size of the input image, but changing the number of channels in the output image. The convolution applies a pre-defined linear filters and bias values to input image to compute each channel. We defined the convolution operation as follow:
We use convolution to modify the spatial frequency characteristics of an image. We create empty matrix for each channel and sum the convolved value within each input channel and add the bias value by the end to computer each output channel for the image. The convolution layer was implemented in MATLAB based on the above equation using two nested for-loops. The MATLAB function imfilter performs convolution on the input image.
% Input:       An array of size N * M * D1
% Output:      An array of size N * M * D2
% Description: Apply a set of predefined linear filters and
%              bias values to the input image to compute each
%              channel of the output image.

function out = convolve(in,filterbanks,biasvectors)
	out = zeros(size(in,1),size(in,2),size(filterbanks,4));
	for l = 1:size(filterbanks,4);   % do D2 times
		sum = double(zeros(size(in,1),size(in,2)));
		for k = 1:size(in,3);
			sum = sum+double(imfilter(in(:,:,k),filterbanks(:,:,k,l),'conv'));
		end
		out(:,:,l) = sum+biasvectors(l);
	end
end
FullConnect
We use fullconnect after we finish all of the convolution and ReLU computations and reduction of image sizes. Fullconnect function is applied to distill all the results down to numbers, one for each class. The fullconnect operation generally does dot products to multiply all of the values in each input image layer, sum up the results, and add the bias value for each filter and . We accomplish this goal by the following way:
In another word, we convert the input image to vector. As a result, the output is an array of size of . We can then apply the numbers to softmax to convert to probability. The fullconnect layer was implemented in MATLAB based on the above equation using three nested for-loops to compute the channel of the output image as the scalar value.
% Input:       An array of size N * M * D1
% Output:      An array of size 1 * 1 * D2
% Description: Apply a filter bank of D2 linear filters
%              and D2 scalar bias values to compute output values.

function out = fullconnect(in,filterbanks,biasvectors)
	out = zeros(1,1,size(filterbanks,4));
	for l = 1:size(filterbanks,4);
		sum = 0;
		for i = 1:size(in,1);
			for j = 1:size(in,2);
				for k = 1:size(in,3);
					sum = sum+filterbanks(i,j,k,l)*in(i,j,k);
				end
			end
		end
		out(:,:,l) = sum+biasvectors(l);
	end
end
Softmax
The end of a convolutional neural network is usually either a softmax classifier or a support vector machine. In our network, we are going to use a softmax classifier. The softmax classifier takes in an array of size . We define the output the following way:
where is defined as:
We use the term to reduce the exponential work we need to compute each time. This will give us the same result and with just less computation needed. The output of this softmax classifier is an array of probabilities for each class. The highest probability in this array is the class you predict. The array should also sum up to and all values should be between and . In MATLAB we would compute the a value first using the max function and after that we can follow our mathematical definition.
% Input:       An array of size 1 * 1 * D
% Output:      An array of the same size
% Description: Take a vector of arbitrary real numbers and
%              converts them into numbers that can be viewed
%              as probabilities, that is, all will lie between
%              0 and 1 and sum up to 1.

function out = softmax(in)
	a = max(in(1,1,:));
	s = sum(exp(in(1,1,:)-a));
	out = exp(in(1,1,:)-a)/s;
end
Procedural Approach
Our -layer convolutional neural network takes a color image as input and produces object class probabilities as output. The -layers can be split into layer types - image normalization, convolution, ReLU, maxpool, fullconnect, and softmax - all of which are described in more detail above. During image normalization, each pixel in the images is normalized to the range from to . During convolution, an input image is convolved with a set of pre-defined filters, taken from CNNparameters.mat. A high response to a filter indicates similarity between the input image and a filter, which in turn indicates the likelihood of a specific object being present. Maxpool and ReLU both extract relevant data from an input image, by pooling over an image or rectifying it respectively. Similarly to the convolution layer, the fullconnect layer applies a filter bank to the input image, turning the input image (a three dimensional matrix) into a vector that can be used for class prediction. To perform class prediction, a sigmoid function, in our case softmax function, produces a class probability for each of the ten training classes.
At several steps in the CNN, image size is reduced, discarding unnecessary image information and retaining information relevant to classification, until the final output, which is a class probability vector. Each value in the final output vector can have a value from to , indicating the softmax probability that an image has one of ten classes. The ten classes tested by our CNN, in order, are: airplane, automobile, bird, cat, deer, dog, frog, horse, ship, and truck. Finally, taking the output probability from the CNN, an image can be classified. The vector index with maximum probability represents the corresponding class of an image.
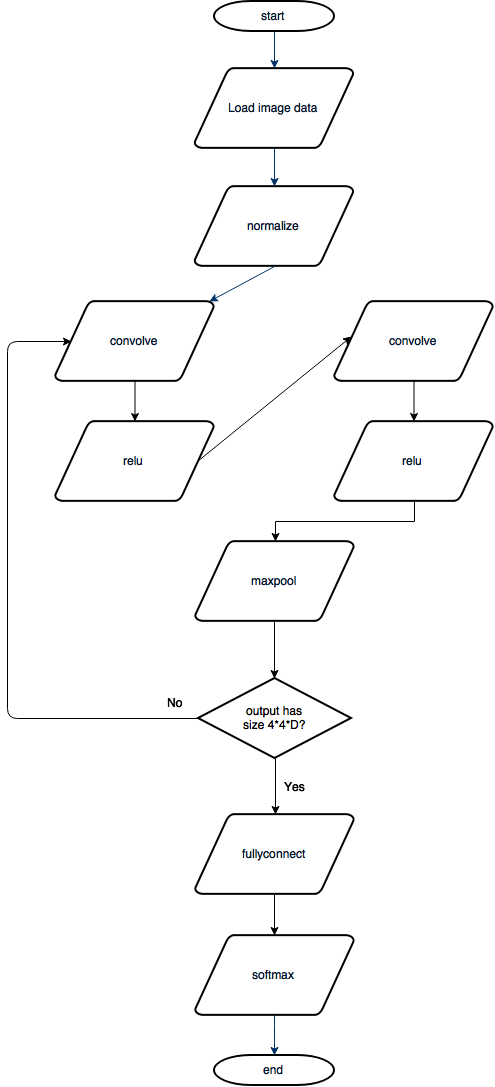
The -layer CNN was implemented using MATLAB. Each layer was implemented using a separate function, as described in the “Layer Types & Description” section. Layer order is shown in the Figure 1, which indicates the flow of control and subroutine structure in the MATLAB code. To improve the generality of our approach, layer order is not hard-coded in MATLAB, allowing for a larger convolutional neural network, with more layers, to be implemented in the case of a larger input image with more filter banks. A general outline of our procedural approach, as shown in Figure 1, is:
- Load input image
- Normalize the input image to be in the range from to
- Perform the following operations ( layers) on the input image in order:
ConvolveReLUConvolveReLUMaxpool
- If the image is not of size (where corresponds to filter bank size) repeat step , otherwise continue to step
- Fullconnect layer which transforms input image into a vector
- Softmax layer which turns input vector into a class probability vector
- Output class probability vector
See CNN.m for the complete CNN. The output is a class probability vector. The user must process the probability vector to classify an image, with the maximum probability index of the output vector indicating the most likely image class. We suggest that an image be classified according to the rules proposed in the “Possible Method for Unknown Category” section.
Experimental Observations
This section displays program behavior, displayed using the debugging file CNN_Execute.m. After the program has finished classifying the input image shown in Figure 1, we display the saved outputs from several layers and observe each layer type to ensure correct function. Based on timing data, we also determine that the convolution layer takes longer time than other layers.
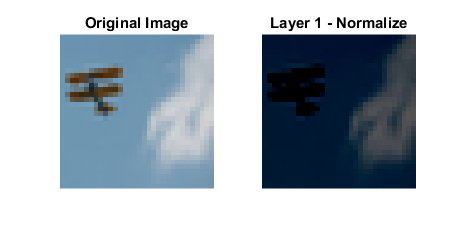
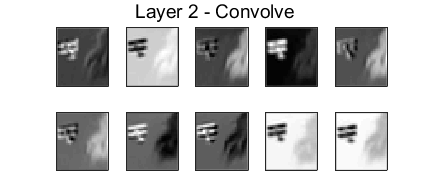
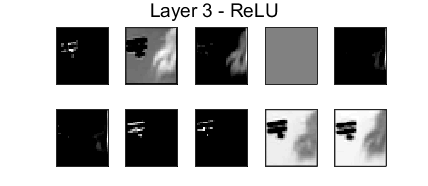
Figure 2 - 8 demonstrate our program does what we think it does. Normalize scales pixel values between and for each color channel. Subsequently, the contrast between pixels becomes smaller, as shown in Figure 2. As shown in Figure 3, the convolution layer identifies important features of an image, convolving ten separate pre-defined filters over the normalized image in Figure 2. ReLU rectifies an input image by removing negative values, setting them to zero. As shown in Figure 4 and Figure 5, identifiable features become more recognizable while irrelevant features are removed. The maxpool function, as shown in Figure 6, pools over an image, extracting the maximum response from an input image (Figure 5) and effectively down-sampling the image to a smaller output resolution.


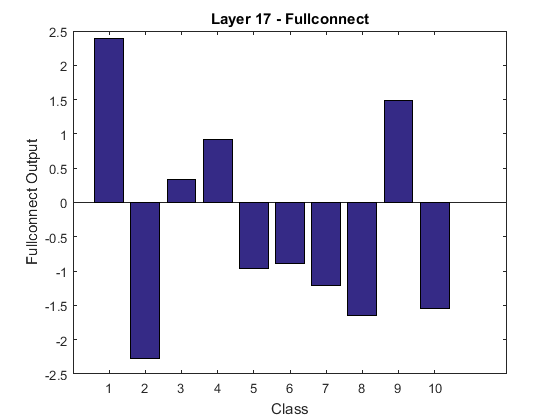
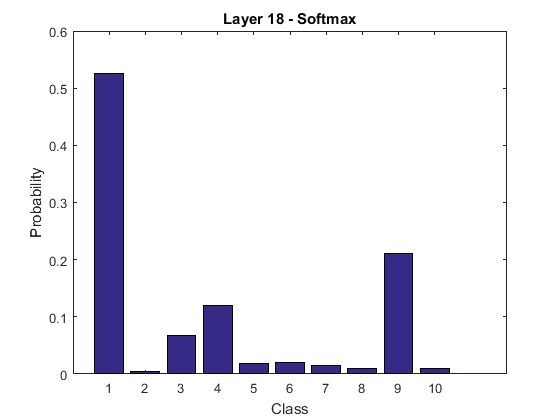
Interestingly, the output vector from the fullconnect layer, shown in Figure 7, is scaled such that higher vector values result in a higher class probability after performing softmax. In Figure 8, softmax normalizes the probabilities to a range from to .
We extract important image information by using convolution-ReLU pairs. By comparing two ReLU layers within each training cycle, i.e., layer 3 (Figure 3) and layer 5 (Figure 4), the feature point (the airplane) in layer 5 is more outstanding than in layer 3. Maxpool reduces the size of an input image, extracting the maximum (significant) responses from the previous layer. This process must repeat several times (3 times for this project) to extract relevant image information so that the input image can be correctly classified.
Results and Accuracy
This section displays accuracy results for the convolutional neural network constructed during this project. Neural network accuracy, while not good enough to confidently identify “most” the pictures in the CIFAR-10 dataset, proved that image classification using a CNN is possible. The results are promising, in that with a more properly trained network, more layers, or larger input images, a convolution neural network, constructed using the six layers types prescribed by this project, has the capability of being an effective tool for image classification.
Table 1 displays the confusion matrix for the convolutional neural network, constructed using pre-labelled input images from CIFAR-10 dataset. Using test images, each row corresponds to the ground truth image classes, specified by the CIFAR-10 dataset file. The columns indicate the number of times an image, with known ground truth, was classified as certain class. The cells along the diagonal, grayed out in Table 1, represent images which were correctly classified to be the same class as their pre-labelled ground truth class. Using the correctly classified images, it is possible to determine the classification accuracy, first of the convolutional neural network as a whole, and then for each individual class.
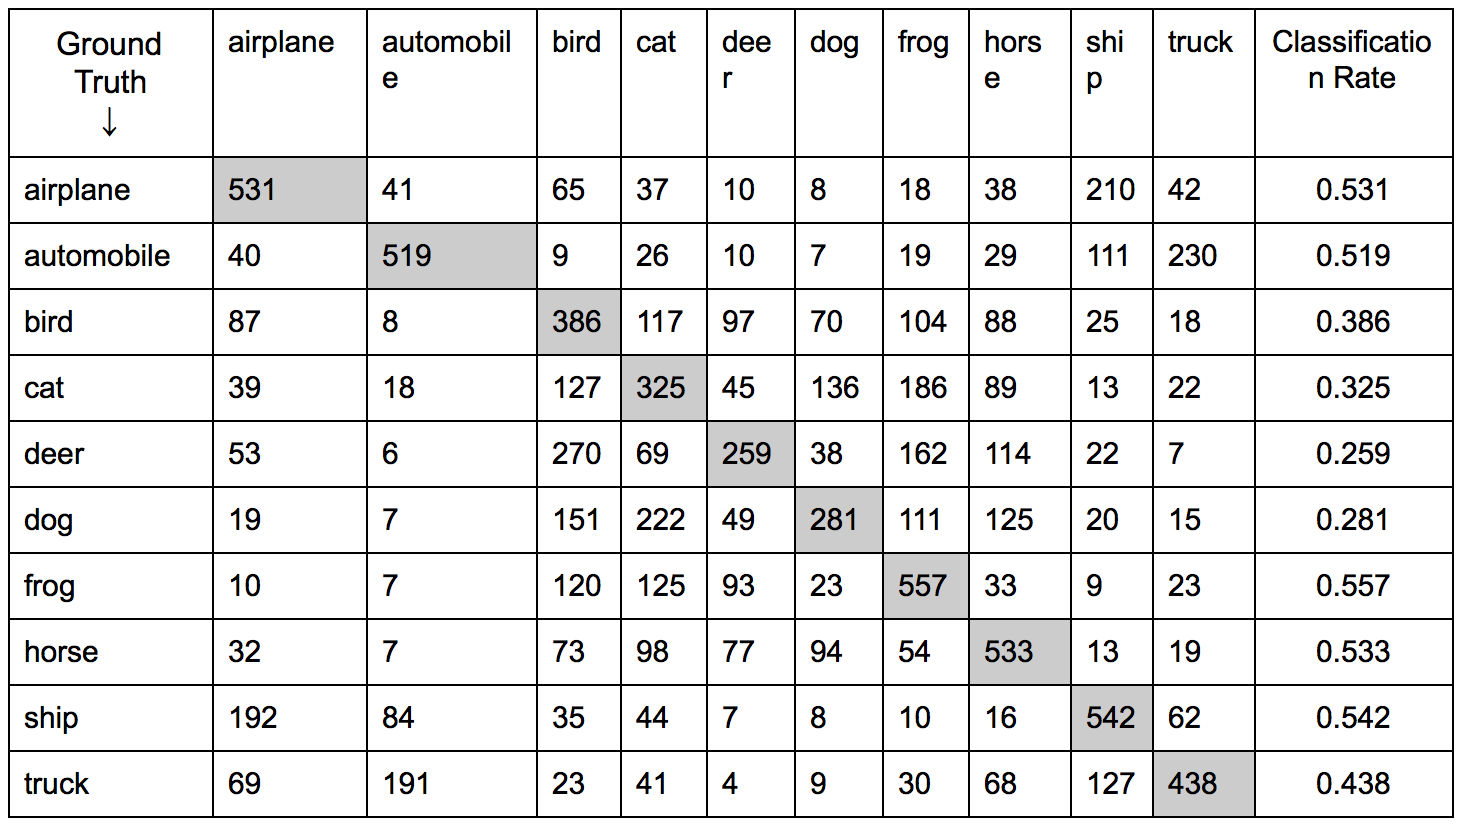
Using the accuracy equation shown above, summing all of the correctly labelled images and then dividing by the total number of images in the test set (), the classification accuracy of the neural network is shown to be across all classes. While better than chance, which would be assumed to accurately “guess” the correct class with an accuracy of , the neural network exhibits relatively poor performance, misclassifying an image more often than correctly classifying an image. Using a similar equation:

The convolutional neural network accuracy for each class, computed by dividing the number of correctly classified images for a class by the total number of images with that class label, is displayed in the last of column of Table 1. Interestingly, CNN classification on images containing animals (bird, cat, deer, dog) performed significantly worse than classification on images containing machines (ship, truck, automobile, airplane), with frogs and horses being exceptions. However, frogs and horses, the two exceptions, were classified more consistently than other class types, with frog classification performing the best of all class types.
Figure 9 displays a top- classification plot, using the CIFAR-10 input images. As specified in the project description, a top- classification plot shows how often the correct image class occurs in the top- classes of the CNN output. In other words, for each integer value on the -axis, equals the percentage of times the correct class was one of the top- ranked classes, determined by sorting the probability scores from the CNN from highest to lowest. Subsequently, percentage must increases as increases because a correct class occurrence at the probability rank will also be contained by the probability rank, where is a positive integer. Subsequently, percentage occurrence at , when the correct class is one of the ten possible CNN class outputs, must be , as shown in Figure 9, because ten is the lowest possible rank for any class. At , correct class occurrence percentage is , which is the same as the overall classification accuracy of the CNN found using the confusion matrix. The curve climbs quickly, clearing at , with a correct class occurrence percentage of . While the CNN displayed somewhat poor performance overall, correctly classifying less than half of of the test images, the results of the top- classification plot are more promising, with the correct image class being one of the top five output classes, by probability rank, percent of the time. Compared to chance performance, which would be expected to contain the correct class only percent of the time, Figure 9 shows that the CNN is able to determine class information about an image.
Possible Method for Unknown Category
Figure 10 and Figure 11 are histograms, created for the purpose of determining how maximum probability, the highest probability score from the softmax layer, is related to classification accuracy. Figure 10 shows a histogram of maximum probability output for all test images. The distribution is nearly normal, skewed slightly toward higher maximum probabilities. Three bins, spanning the range , account for nearly one third of the entire dataset, containing more than images each, and indicating that the maximum probability output of the CNN most often fell within that range.
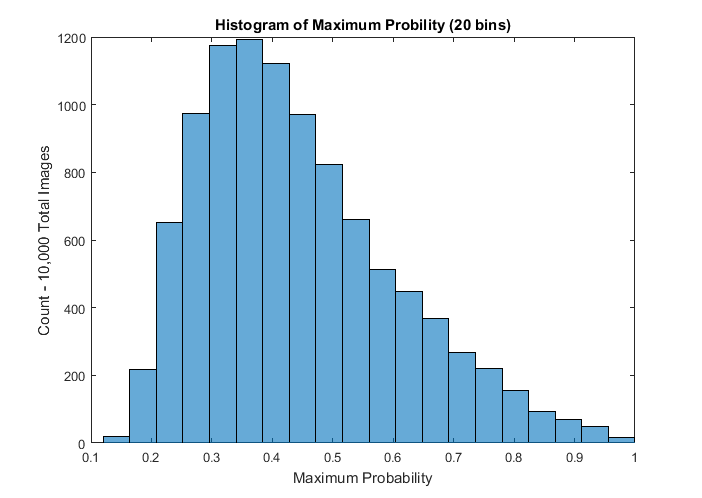
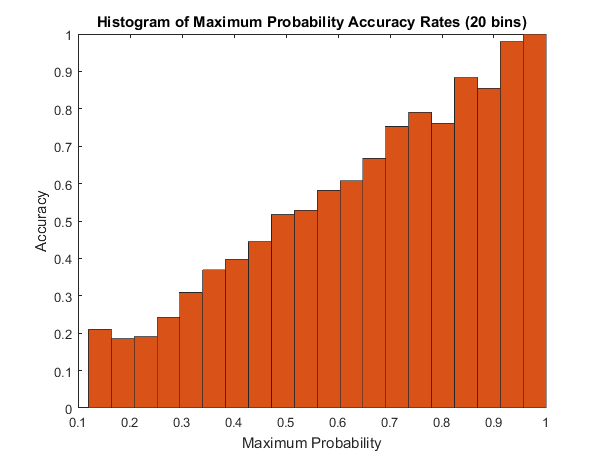
Figure 11 uses the same bins as Figure 10 to group images by maximum probability output, and shows the classification accuracy of the CNN at those maximum probabilities. As shown in Figure 11, classification accuracy, obtained by dividing the number of correctly classified images in a bin by the total number of images in a bin, tracks closely with the maximum probability output from softmax, with accuracy increasing as maximum probability increases. For the bin spanning the range , classification accuracy is , meaning that, with a maximum probability greater than , the CNN is able to correctly predict an image’s class more than half of the time. This is an important threshold because it indicates that the CNN is more likely to correctly classify an image than misclassify an image. Subsequently, an “unknown” category can be implemented via thresholding. In order to extend classification to include an “unknown” category, if the maximum probability is below , it should be labelled as “unknown”, because it is more likely that the CNN does not know the correct image class than that the image has been correctly classified.
Depending on the specific classification application, this thresholding method may or may not be advisable. If misclassification is costly, then adding an “unknown” category, when maximum probability is below , may be ideal. However, when the maximum probability output is below , the CNN still performs better than random chance classification, which would be expected to correctly classify an image one tenth of the time using ten classes. Subsequently, the CNN can provide information about an image, even with a low maximum probability output, but it is prone to misclassification.
Results on External Images
We decided to try out our classifier on ten external images to see the performance on something from a new dataset. The convolutional neural network correctly guessed six out of ten of these images. It failed to accurately predict airplane, bird, dog, and frog. Although it failed to classify these images it had always predicted the correct class as the second highest guess. Another interesting result we saw here was that when it misclassified a result it still chose categories similar to it as the result. For example, when airplane was misclassified it was said to be a ship, which is another object that is usually big and white. Below are our full results on this test.

Co-Author
- Dan Bonness
- Siwei Liu
- Waleed Malik